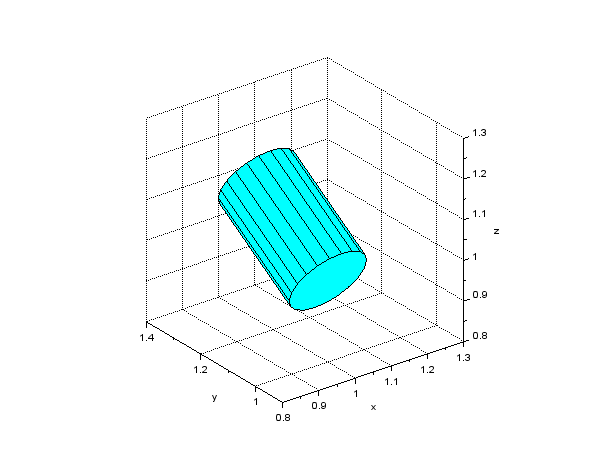
A Scilab script to draw a cylinder shape in a general configuration is shown in Code 1. The result of the drawing by this script is shown in Figure 1.
// make_cylinder_general.sce

clear; xdel(winsid());

exec('eulerXYZ.sci', -1);
exec('transver.sci', -1);
exec('genpat.sci', -1);

// Reference position
r = [1; 1; 1];

// Reference orientation
R = eulerXYZ(-%pi/3, 0, 0);

// Cylinder spec
Radius = 0.1;
Height = 0.3;
SideCount = 20;

// Vertices
vertices_0 = zeros(2*SideCount, 3);
for i = 1:SideCount
    theta = 2*%pi/SideCount*(i-1);
    vertices_0(i,:) = [Radius*cos(theta), Radius*sin(theta), 0];
    vertices_0(SideCount+i,:) = [Radius*cos(theta), Radius*sin(theta), Height];
end
vertices = transver(vertices_0, r, R);

// Side faces
sideFaces = zeros(SideCount, 4);
for i = 1:(SideCount-1)
    sideFaces(i,:) = [i, i+1, SideCount+i+1, SideCount+i];
end
sideFaces(SideCount,:) = [SideCount, 1, SideCount+1, 2*SideCount];

// Bottom faces
bottomFaces = [
    1:SideCount;
    (SideCount+1):2*SideCount];

// Side patches
sidePatches = genpat(vertices, sideFaces);

// Bottom patches
bottomPatches = genpat(vertices, bottomFaces);

// Draw patches
h_fig = figure;
h_fig.background = 8;
h_sidePat = plot3d(sidePatches.x, sidePatches.y, sidePatches.z);
h_sidePat.color_mode = 4;
h_sidePat.foreground = 1;
h_sidePat.hiddencolor = 4;
h_bottomPat = plot3d(bottomPatches.x, bottomPatches.y, bottomPatches.z);
h_bottomPat.color_mode = 4;
h_bottomPat.foreground = 1;
h_bottomPat.hiddencolor = 4;

// Axes settings
xlabel("x"); ylabel("y"); zlabel("z");
h_axes = gca();
h_axes.isoview = "on";
h_axes.box = "off";
h_axes.rotation_angles = [63.5, -127];
h_axes.data_bounds = [0.8, 0.9, 0.8; 1.3, 1.4, 1.3];
xgrid;