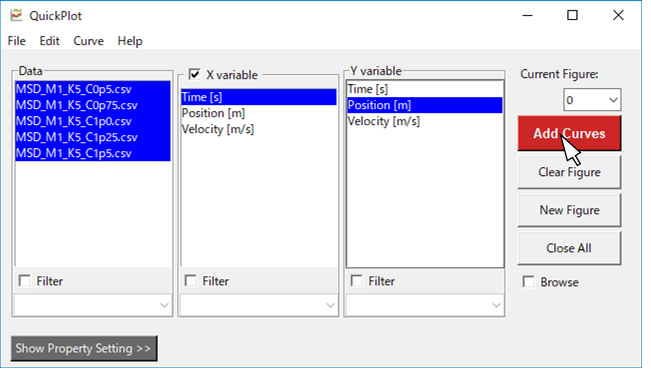
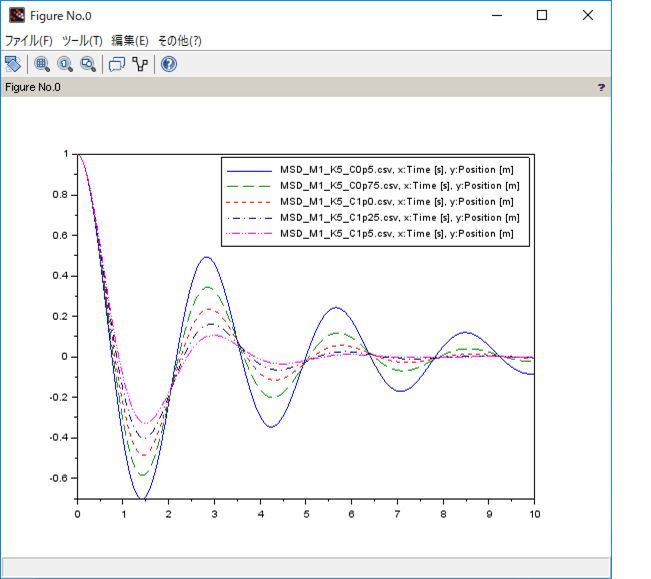
QuickPlot is a Scilab module that provides a GUI-based 2D line plotting tool. You can quickly draw plots without writing a code, which is useful for quickly viewing and comparing a large amount of data stored in multiple files, such as simulation results or experimental results.
Run the following command on Scilab 6.0 or above and restart Scilab.
--> atomsInstall("quickplot")
Run the following command on Scilab for the main window of QuickPlot to appear.
--> quickplot
For usage, please refer to the "User's Manual" which can be viewed by selecting "Help" -> "User's Manual" from the QuickPlot menu bar.
The User's Manual can also be downloaded from the link below.