One use of a simulation model is parameter study. Parameter study is a method to study how a particular output is influenced by some parameters, especially design variables, by conducting multiple analyses under the same conditions while incrementally changing the values of the parameters. This chapter presents an example of parameter study using the simulation model of a crank-slider mechanism we constructed in Problem 6.
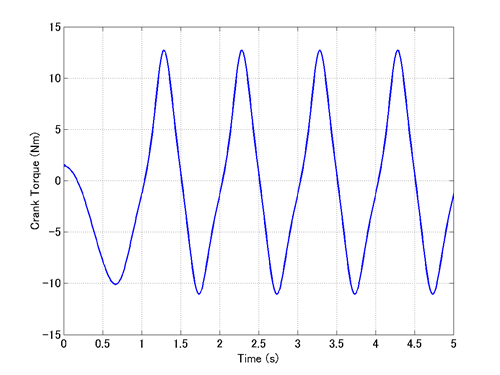
For the simulation model of Problem 6 in the previous chapter, the magnitude of torque required to keep the crank turning at a constant angular velocity of 2π(rad/s) is obtained as the reaction torque of the axial rotation joint about the z-axis (the crank torque). Code 1 below is a MATLAB script that reads the jnt file and plot the crank torque with respect to time. (Refer to Chapter 16 for the format of a jnt file.) The graph of the crank torque plotted by this script is shown in Figure 1.
% plot_crank_torque.m

clear; close all;

[LABEL,DATA] = MBDynLoad('crank_slider_2.jnt');

T_Crank = DATA(:,7,LABEL==2);

t = 1.e-2*[0:length(T_Crank)-1];

plot(t,T_Crank,'LineWidth',1.5);
grid on;
xlim([0,5]);
set(gca,'FontSize',14);
xlabel('Time (s)','FontSize',14);
ylabel('Crank Torque (Nm)','FontSize',14);
Let's find out how the slider offset influences the crank torque by parameter study. Using the input file for Problem 6, "crank_slider_2.mbd," we conduct simulations while changing the value of the variable "Offset_Slider" as follows.
0.00, 0.02, 0.04, 0.06, 0.08, 0.10, 0.12, 0.14, 0.16, 0.18, 0.20
Here, since the unit of the length is assumed to be a meter, the above means that the slider offset is changed from 0(cm) to 20(cm) with a step size of 2(cm).
Figure 2 shows the variation of the crank torque with respect to time for each amount of the slider offset.
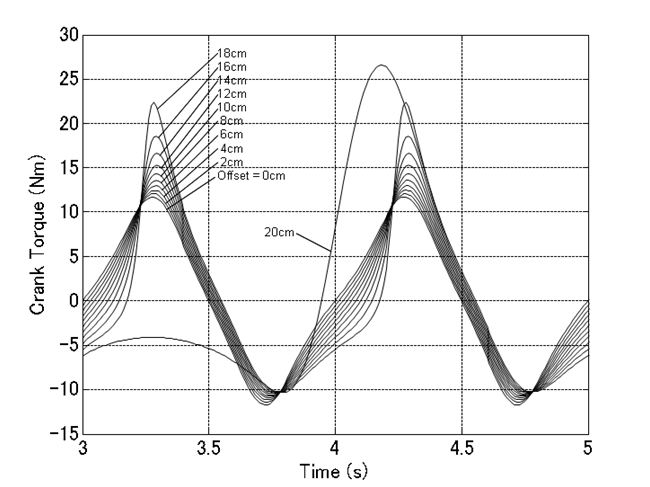
From Figure 2, we can see that while the behavior of the crank torque changes continuously with the slider offset between 0(cm) and 18(cm), it changes discontinuously between 18(cm) and 20(cm). This is because when the slider offset increases as far as the length of the crank, which is 20(cm), a qualitative change occurs in the motion of the mechanism as we can see from the animation in Movie 1.
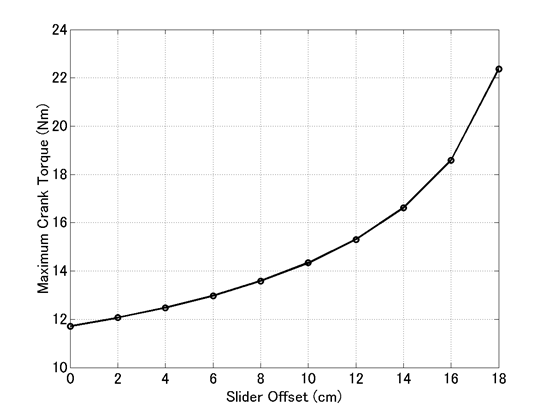
Figure 3 shows a graph of the maximum crank torque versus the slider offset between 0(cm) and 18(cm). From this graph we can see that as the slider offset increases, more crank torque is required.
Similarly, we conduct simulations while changing the value of the variable "Length_Conrod" as follows.
0.30, 0.32, 0.34, 0.36, 0.38, 0.30, 0.42, 0.44, 0.46, 0.48, 0.50
The above means that the conrod length is changed from 30(cm) to 50(cm) with a step size of 2(cm).
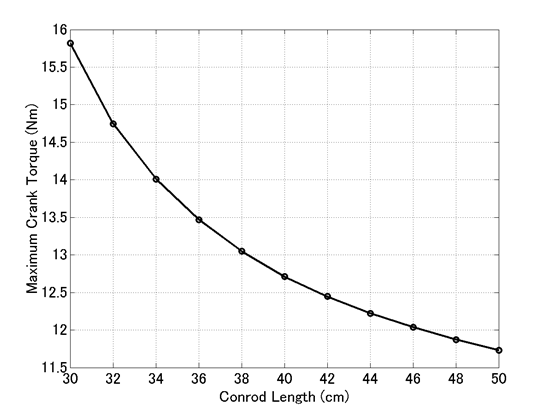
Figure 4 shows a graph of the maximum crank torque versus the conrod length. From this graph we can see that as the conrod length increases, less crank torque is required.