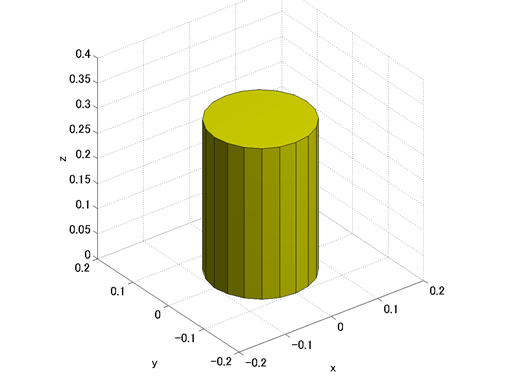
Let's create a cylinder shape using patch. Let the basic configuration of a cylinder be the configuration with the center of the bottom circle at the origin of the coordinate system and the center axis coinciding with the coordinate Z-axis. A MATLAB script to draw a cylinder shape in the basic configuration is shown in Code 1. The result of the drawing by this script is shown in Figure 1.
% make_cylinder_special.m

clear; close all;

% Cylinder spec
Radius = 0.1;
Height = 0.3;
SideCount = 20;

% Vertices
vertices = zeros(2*SideCount, 3);
for i = 1:SideCount
    theta = 2*pi/SideCount*(i-1);
    vertices(i,:) = [Radius*cos(theta), Radius*sin(theta), 0];
    vertices(SideCount+i,:) = [Radius*cos(theta), Radius*sin(theta), Height];
end

% Side faces
sideFaces = zeros(SideCount, 4);
for i = 1:(SideCount-1)
    sideFaces(i,:) = [i, i+1, SideCount+i+1, SideCount+i];
end
sideFaces(SideCount,:) = [SideCount, 1, SideCount+1, 2*SideCount];

% Bottom faces
bottomFaces = [
    1:SideCount;
    (SideCount+1):2*SideCount];

% Draw patches
figure(1);
h_side = patch('Faces', sideFaces, 'Vertices', vertices, 'FaceColor', 'y');
h_bottom = patch('Faces', bottomFaces, 'Vertices', vertices, 'FaceColor', 'y');

% Axes settings
xlabel('x'); ylabel('y'); zlabel('z');
axis vis3d equal;
view([-37.5, 30]);
camlight;
grid on;
xlim([-0.2, 0.2]);
ylim([-0.2, 0.2]);
zlim([-0, 0.4]);